Using Excel 2007 Chart in VB.NET 2005
By: Issac in VB.net Tutorials on 2009-01-31
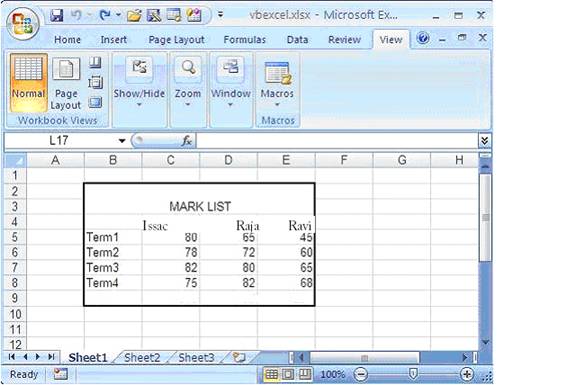
We can create Chart in Excel using VB.NET 2005 . The following section shows how to create a Chart in Excel 2007 through VB.NET source code . Before we crate a Chart , we have to fill data in Excel sheet. After enter data your Excel sheet is look like the following picture.
After filling the data , We have to create a chart object in VB.NET and configure the Chart object with necressary data like positions , size , data range , chart type etc..
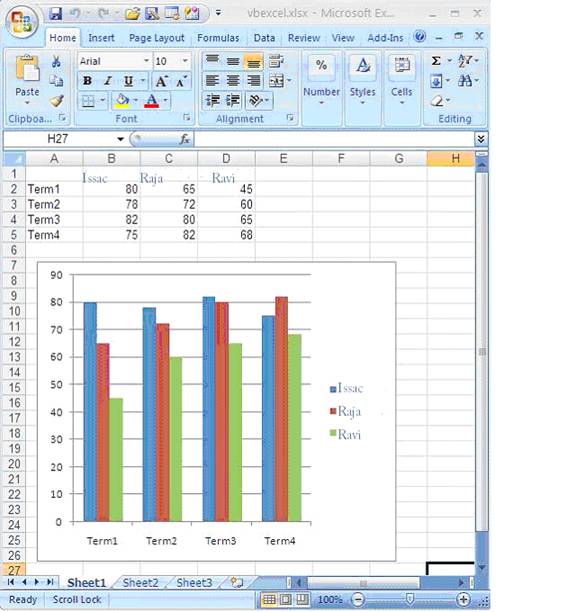
The following picture shows the excel file after created a chart.
Imports Excel = Microsoft.Office.Interop.Excel
Public Class Form1
    Private Sub Button1_Click(ByVal sender As System.Object, _
  ByVal e As System.EventArgs) Handles Button1.Click

        Dim xlApp As Excel.Application
        Dim xlWorkBook As Excel.Workbook
        Dim xlWorkSheet As Excel.Worksheet
        Dim misValue As Object = System.Reflection.Missing.Value

        xlApp = New Excel.ApplicationClass
        xlWorkBook = xlApp.Workbooks.Add(misValue)
        xlWorkSheet = xlWorkBook.Sheets("sheet1")

        'add data
        xlWorkSheet.Cells(1, 1) = ""
        xlWorkSheet.Cells(1, 2) = "Issac"
        xlWorkSheet.Cells(1, 3) = "Raja"
        xlWorkSheet.Cells(1, 4) = "Ravi"

        xlWorkSheet.Cells(2, 1) = "Term1"
        xlWorkSheet.Cells(2, 2) = "80"
        xlWorkSheet.Cells(2, 3) = "65"
        xlWorkSheet.Cells(2, 4) = "45"

        xlWorkSheet.Cells(3, 1) = "Term2"
        xlWorkSheet.Cells(3, 2) = "78"
        xlWorkSheet.Cells(3, 3) = "72"
        xlWorkSheet.Cells(3, 4) = "60"

        xlWorkSheet.Cells(4, 1) = "Term3"
        xlWorkSheet.Cells(4, 2) = "82"
        xlWorkSheet.Cells(4, 3) = "80"
        xlWorkSheet.Cells(4, 4) = "65"

        xlWorkSheet.Cells(5, 1) = "Term4"
        xlWorkSheet.Cells(5, 2) = "75"
        xlWorkSheet.Cells(5, 3) = "82"
        xlWorkSheet.Cells(5, 4) = "68"

        'create chart
        Dim chartPage As Excel.Chart
        Dim xlCharts As Excel.ChartObjects
        Dim myChart As Excel.ChartObject
        Dim chartRange As Excel.Range

        xlCharts = xlWorkSheet.ChartObjects
        myChart = xlCharts.Add(10, 80, 300, 250)
        chartPage = myChart.Chart
        chartRange = xlWorkSheet.Range("A1", "d5")
        chartPage.SetSourceData(Source:=chartRange)
        chartPage.ChartType = Excel.XlChartType.xlColumnClustered

        xlWorkSheet.SaveAs("C:\vbexcel.xlsx")
        xlWorkBook.Close()
        xlApp.Quit()

        releaseObject(xlApp)
        releaseObject(xlWorkBook)
        releaseObject(xlWorkSheet)

        MsgBox("Excel file created , you can find the file c:\")
    End Sub

    Private Sub releaseObject(ByVal obj As Object)
        Try
            System.Runtime.InteropServices.Marshal.ReleaseComObject(obj)
            obj = Nothing
        Catch ex As Exception
            obj = Nothing
        Finally
            GC.Collect()
        End Try
    End Sub
End Class
Add Comment
This policy contains information about your privacy. By posting, you are declaring that you understand this policy:
- Your name, rating, website address, town, country, state and comment will be publicly displayed if entered.
- Aside from the data entered into these form fields, other stored data about your comment will include:
- Your IP address (not displayed)
- The time/date of your submission (displayed)
- Your email address will not be shared. It is collected for only two reasons:
- Administrative purposes, should a need to contact you arise.
- To inform you of new comments, should you subscribe to receive notifications.
- A cookie may be set on your computer. This is used to remember your inputs. It will expire by itself.
This policy is subject to change at any time and without notice.
These terms and conditions contain rules about posting comments. By submitting a comment, you are declaring that you agree with these rules:
- Although the administrator will attempt to moderate comments, it is impossible for every comment to have been moderated at any given time.
- You acknowledge that all comments express the views and opinions of the original author and not those of the administrator.
- You agree not to post any material which is knowingly false, obscene, hateful, threatening, harassing or invasive of a person's privacy.
- The administrator has the right to edit, move or remove any comment for any reason and without notice.
Failure to comply with these rules may result in being banned from submitting further comments.
These terms and conditions are subject to change at any time and without notice.
- Data Science
- Android
- React Native
- AJAX
- ASP.net
- C
- C++
- C#
- Cocoa
- Cloud Computing
- HTML5
- Java
- Javascript
- JSF
- JSP
- J2ME
- Java Beans
- EJB
- JDBC
- Linux
- Mac OS X
- iPhone
- MySQL
- Office 365
- Perl
- PHP
- Python
- Ruby
- VB.net
- Hibernate
- Struts
- SAP
- Trends
- Tech Reviews
- WebServices
- XML
- Certification
- Interview
categories
Related Tutorials
Changes in Controls from VB6 to VB.net
Unstructured Exception Handling in VB.net
Structured Exception Handling in VB.net
Creating Sub Procedures in VB.net
Passing a Variable Number of Arguments to Procedures in VB.net
Specifying Optional Arguments with default values in Procedures in VB.net
Preserving a Variable's Values between Procedure Calls in VB.net
Throwing an Exception in VB.net
Comments